h1

MiniConsole

March 2, 2013

I just released a little tool called MiniConsole. It’s a general purpose console, that can launch commands like DOS shell commands, batch files, python scripts, etc.

miniconsole screenshot

I’m using it to launch the dev server of Google App Engine, actually devappserver2 which only comes as a python command line to execute in a DOS prompt. So by launching it in MiniConsole I can resize the window as I want and color errors, warnings, exception, 404s, 500s, etc. In my case, why not use Google App Engine Launcher? Because the log window is not that good and it doesn’t support devappserver2 anyway.

It has very simple file system completion and remembers the last command, working directory, highlights, window size and position. You know, the little things. It can also redirect CTRL+C to the process, which for GAE will close it properly, saving datastore, search indexes, etc.

Download and more info here

h1

NetDebugLog for Linux, NetDebugPlot update

September 16, 2012

NetDebugLog, the open source C++ client for NetDebugPlot, is now compatible with Linux (tested with Ubuntu 12.04.1 LTS)!

NetDebugPlot also got a major update with a huge performance increase and a few other improvements.

netdebuglog windows linux ubuntu logo

h1

NetDebugPlot: Real-time charts for debugging

September 8, 2012

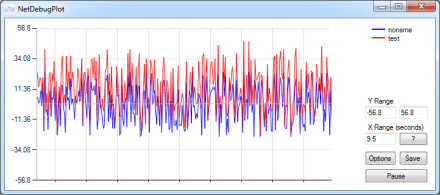
I just released NetDebugPlot, a tool to debug and visualize program internals. It’s a basic real-time line chart viewer that can get connected to a local or remote program via NetDebugLog.

NetDebugPlot: real-time chart for debugging

Here is the feature list:

  • Real-time line charts
  • Scale time and Y axis with scroll mouse or text boxes
  • Each series has its own color
  • Pause chart (data continues to be received)
  • Save chart to .jpg image
  • Change client’s port number

NetDebugLog is an open source C++ client for NetDebugPlot (GitHub project page). There are 1 .cpp and 1 .h files to include in a project to make it all work. It consists of a TCP client, a couple configuration and logging functions. It’s currently implemented with Winsock and QueryPerformanceCounter (high resolution timer) and could easily be ported to other platforms.

Here is how to use it:

#include <iostream>
#include "NetDebugLog/NetDebugLog.h"

int main(int argc, char* argv[])
{
	static int delay = 33;

	// Those are default
	//SetNetLogIPAddress("127.0.0.1");
	//SetNetLogPort(13000);
	//SetNetLogEnabled(false);

	srand(0);
	while (true)
	{
		float val1 = (float)((rand() % 25)*(rand() % 2 == 0?1:-1));
		float val2 = val1 + (float)(rand() % 25);

		NetLog(val1);
		NetLog("test", val2);

		Sleep(delay);
	}

	return 0;
}

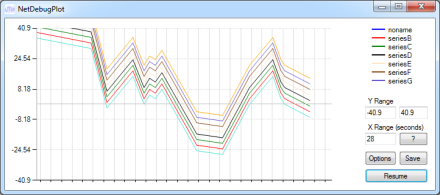
More screenshots with various series and zoom levels / time scales:

NetDebugPlot: real-time chart and data series

NetDebugPlot: real-time chart and zooming screenshot

Download and more info here

h1

MiniPlot and debugging

August 29, 2012

There are tons of function plotters and there is Excel to plot data series but I needed something else so I made MiniPlot.

Instantly plot data with MiniPlot

This software lets you type in or paste any number of data series and generate corresponding line charts on the fly. It’s dead simple to use and there is no button to click to generate charts, it’s instantaneous.

Here is the feature list:

  • Updates as you type
  • Automatically fits all series
  • Auto axis scale with window size
  • Each series has its own color
  • Chart types: line, point, column, area
  • Save chart as .jpg image
  • Copy image to clipboard

I spend a lot of time reading the Visual Studio output window and the lines coming out of logs and tracepoints. But it can be full of other garbage like other log categories that I don’t really want to turn off, or random Visual Studio output about threads, dlls and all.
When I need to visualize my data, I’d copy paste the VS output in a text editor, remove all the garbage and end up with my values properly printed each per line, I’d open up Excel and paste those values, insert a new line chart, and I’d finally have a chart representing my data.

Now, with MiniPlot I just select all the text in the Visual Studio output window and paste it in there and I have my line chart instantly.
Whenever I can I just add tracepoints to the program I’m debugging, put in the textbox something like: playerSpeed {playerSpeed}, and paste the output in MiniPlot (which ignores all the crap that doesn’t match the 2 supported formats to add a point) so I can visualize what’s going on without recompiling my application nor having to use a text editor + Excel.

Series can be displayed as line, point, column or area charts.

MiniPlot chart types (point, line, column, area)

There is no install needed (though you need .NET Framework 3.5), it’s just a 500KB standalone executable.

Download and more info here

h1

It’s alive!

August 27, 2012

It’s been more than 3 years since I posted anything, the blog has survived and has surprisingly grown in traffic (between 1500 and 2100 views per months [not unique] for a total of 63,220 views)! Not much but way more than I expected.

This is mostly due to the Photoshop math with GLSL shaders and Level control shader posts that are being linked quite a lot.

Those shaders are used in several cool projects including:

I’m opening my new website www.shazbits.com where I publish my new technical experiments. This blog is part of it and also accessible at blog.shazbits.com.

h1

Levels control shader

January 28, 2009

A little piece of code to reproduce the Levels control of Photoshop…

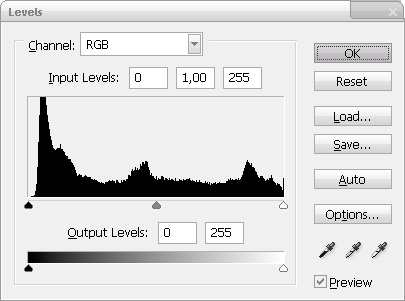
levels-all

Input levels:

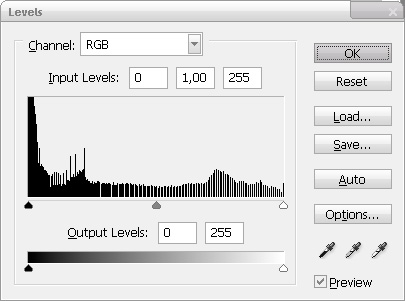
I already talked about the gamma correction (mid-tone slider), and I won’t explain what the shadows and highlights (black/white points) sliders are doing (excellent article here) but basically these can be used to remap the tonal range of the image. Here is how it’s calculated:

#define GammaCorrection(color, gamma)  pow(color, vec3(1.0 / gamma))
#define LevelsControlInputRange(color, minInput, maxInput) min(max(color – vec3(minInput), vec3(0.0)) / (vec3(maxInput) – vec3(minInput)), vec3(1.0))
#define LevelsControlInput(color, minInput, gamma, maxInput) GammaCorrection(LevelsControlInputRange(color, minInput, maxInput), gamma)

Example with values from the 1st screenshot (blackpoint = 90/255, gamma = 4, whitepoint = 150/255), red: original color, green: blackpoint & whitepoint modified, blue: same with gamma:

levels-input

Output levels:

This is useful to shorten the tonal range meaning compressing it to reduce contrast and shift it, details here.

#define LevelsControlOutputRange(color, minOutput, maxOutput) mix(vec3(minOutput), vec3(maxOutput), color)

Example with values from the 1st screenshot (min output = 40/255, max output = 180/255), red: original color, green: output levels applied:

levels-output

Putting it all together:

#define LevelsControl(color, minInput, gamma, maxInput, minOutput, maxOutput) LevelsControlOutputRange(LevelsControlInput(color, minInput, gamma, maxInput), minOutput, maxOutput)

Same example but both input and output levels taken into account, red: original color, green: final result:

levels-output-input

So these macros make it quite easy to increase or reduce contrast, shift and clip tonal range, lighten or darken shadows and highlights. I added the (GLSL / HLSL) code to the Photoshop Math shaders.

h1

Photoshop gamma correction shader

January 22, 2009

After reproducing contrast, hue, saturation, brightness controls of Photoshop in pixel shaders, here is the gamma correction filter 🙂

gamma-correction-photoshop-levels

Photoshop

There are 2 ways of changing gamma in Photoshop:

  • Image | Adjustments | Exposure…
  • Image | Adjustments | Levels… (or CTRL+L) and then move the midtone slider.

Gamma correction is not the same thing than Brightness at all, even if it can give the impression it is. For example here is the histogram of my original image:

gamma-correction-levels-before

Then after setting the gamma to 0.5 (it compresses the highlights and stretches the shadows):

gamma-correction-levels-after

And here it is after lowering the brightness (Image | Adjustments | Brightness/Contrast…):

gamma-correction-levels-after-brightness

Here you can see it clipped the values after some threshold in the shadows (and also in the highlights) and you’re loosing a lot of lighting information in this case. That’s actually why I wanted to have also a gamma control in my post-processing effects.

Shader

A little macro:

// Gamma from 9.99 to 0.1
#define GammaCorrection(color, gamma)   pow(color, 1.0 / (gamma))

color = GammaCorrection(color, 0.1);

Here are the curves it produces with extreme values (limits of Photoshop [9.99, 0.1]):

gamma-correction-curves_tn

So you see it stays in the same range and give a non-linear luminance (if correction value is different than 1). By the way I used this awesome web function grapher here.

By zooming and taking a very close look I noticed a few tiny differences with Photoshop in the shadows (seriously you need to toggle screenshot from shader and photoshopped image quickly and scan the image to see where it’s not the same). Photoshop on the left, shader version on the right (gamma = 0.1).

gamma-correction-comparison

I also saw that the gamma in Photoshop (on the left) produced some banding artefacts somewhere, and it didn’t in my shader (on the right),  well.. :):

gamma-correction-comparison2

I added the code in my Photoshop Math (GLSL/HLSL) shaders.

h1

Photoshop math with HLSL shaders

January 8, 2009

See my original post about Photoshop math in GLSL (blending modes, contrast, desaturation, RGB to HSL). Now it’s also in HLSL!

Download PhotoshopMath.hlsl

h1

Photoshop math with GLSL shaders

January 5, 2009

I usualy play with Photoshop to try post-processing effects on photos or game screenshots, it’s a lot faster than coding directly anything in shaders, but at the end I wanted to see my effects running in real-time. So I adapted a big part of the C-like code from this famous Photoshop blending mode math page + missing blending modes to GLSL (and now HLSL!) code and I added a few other useful things from Photoshop, such as Hue/Saturation/Luminance conversion, desaturation, contrast.

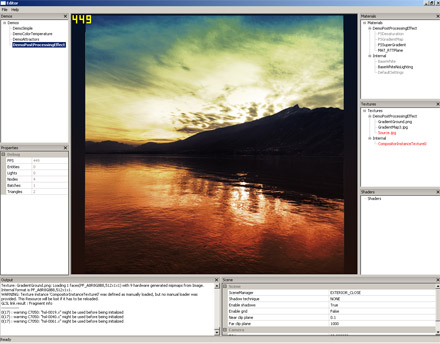
For example, I tried combining a few things in my Editor:
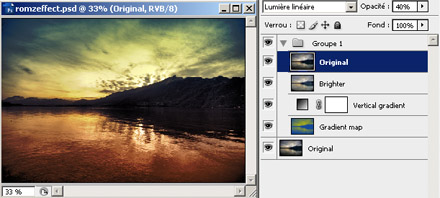
photoshopmath_tn

photoshopmath_editor_tn

Translating Photoshop operations on layers gives this kind of code:

uniform sampler2D Tex;
uniform sampler1D GradientMap;
uniform sampler1D GradientGround;

varying vec2 uv;

void main()
{

vec3 color = texture2D(Tex, uv).xyz;

// Split-tone
vec4 colorDesat = Desaturate(color, 1.0);
vec3 splitColor = texture1D(GradientMap, colorDesat.r).rgb;
vec3 pass1 = BlendColor(color, splitColor);

// Vertical gradient
vec4 verticalGradientColor = texture1D(GradientGround, uv.y);
vec3 pass2 = mix(pass1, BlendColor(pass1, verticalGradientColor.rgb), verticalGradientColor.a);

// Luminosity
vec3 pass3 = mix(pass2, BlendLuminosity(pass2, color + vec3(0.08)), 0.5);

// Linear light at 40%
vec3 pass4 = mix(pass3, BlendLinearLight(pass3, color), 0.4);

// Final
gl_FragColor = vec4(pass4, 1.0);

}

Here is the list of blending modes and functions I got:

Blending modes:

  • Normal
  • Lighten
  • Darken
  • Multiply
  • Average
  • Add
  • Substract
  • Difference
  • Negation
  • Exclusion
  • Screen
  • Overlay
  • SoftLight
  • HardLight
  • ColorDodge
  • ColorBurn
  • LinearDodge
  • LinearBurn
  • LinearLight
  • VividLight
  • PinLight
  • HardMix
  • Reflect
  • Glow
  • Phoenix
  • Hue
  • Saturation
  • Color
  • Luminosity

Functions:

  • Desaturation
  • RGBToHSL (RGB to Hue/Saturation/Luminance)
  • HSLToRGB (Hue/Saturation/Luminance to RGB)
  • Contrast

Here is my GLSL code, almost all the blending modes are macros and some do per-channel operation so it could run faster using vector operations with masks (to take into account the values per component), but still I guess it could help 🙂

Download PhotoshopMath.glsl

Update:

Oh and by the way you noticed the Split-Tone pass in my example:

// Split-tone
vec4 colorDesat = Desaturate(color, 1.0);
vec3 splitColor = texture1D(GradientMap, colorDesat.r).rgb;
vec3 result = BlendColor(color, splitColor);

It’s just the same thing than the Gradient Map… of the Create new fill or adjustment layer in Photoshop but blended in Color mode, which reminds me Color Temperature and Cross-Processing effects 🙂

Update:

I updated the .glsl file, because I forgot a line in the ContrastSaturationBrightness() function and I had some issues on specific hardware due to conditional returns, so now it’s fixed.

And now, here is the HLSL version 🙂

Download PhotoshopMath.hlsl

h1

Real-Time Peter de Jong Attractors

December 15, 2008

A simple B&W version. Again, everything is done on the CPU, running at 80fps on my single core 3500+. 10000 iterations per frame. Random but still a bit too cyclic due to my way of changing the attractor’s parameters (almost same frequency and amplitude a bit too extreme causing these empty frames). It also does produce blank frames with specific parameter values (not necessarily extremes), wonder if that’s the same with Clifford attractors.